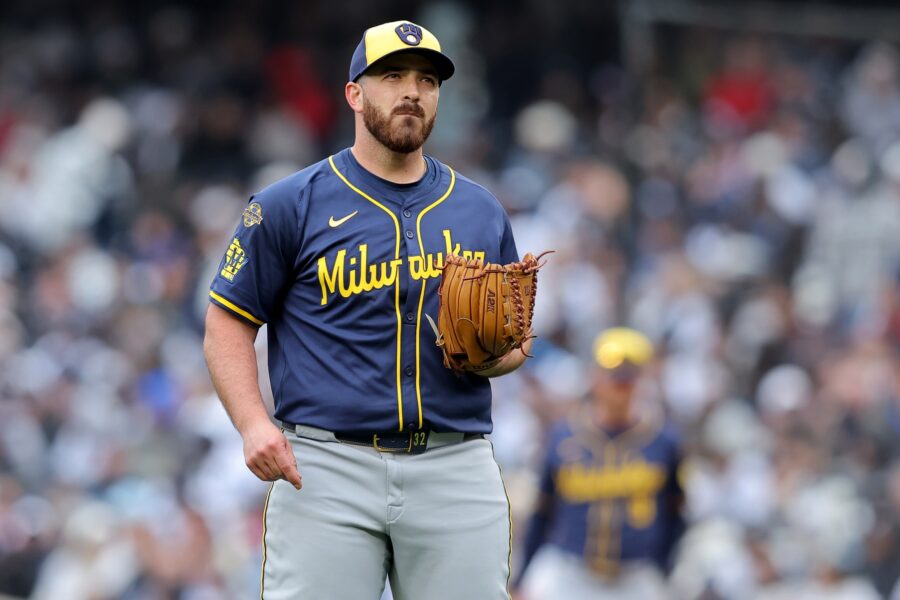
Complete games, saves, and the number of pitchers used in a game…
If you want to see how the game of baseball has evolved in the last 50 years, look at the numbers for these stats above. In simple terms, (1) there are more pitchers used by teams in a game; (2) there are fewer complete games; and (3) saves are clearly an important stat to the success of an MLB team.
MLB pitching stats from 1922 to 2022
Let’s put a few numbers on these statements. First. Let’s start with baseball in the last 100 years. Did you know:
- In 1922, an average 1.83 pitchers were used by a team in a game; there were a total of 1,583 complete games and 190 saves.
- In 1972, 50 years later, an average of 2.44 pitchers were used by a team in a game; there were 1,009 complete games, and saves had increased to 733.
- Last year, 2022, the average team used 4.27 pitchers per game (an increase of 75% since 1972); complete games dropped to 36 total for all of baseball; and total saves had increased to 1,232 (a 68% increase from 1972).
That’s the snapshot of Major League Baseball in the past 100 seasons. If you are a baseball fan, these numbers are not telling you anything that you already didn’t know; it’s just that seeing the numbers confirms the vast changes that have come to the game, especially when it comes to pitching.
Now for the Brewers. They began their journey in 1969 as the Seattle Pilots and have now played 54 seasons, 53 in Milwaukee. Here is a look at the stats for average pitchers used in a game, complete games, and saves in 1972, 1982, 1992, 2002, 2012 and last season, 2022. These numbers should give us a glance at how the changes in pitching have made an impact on the Brewers pitching stats.
Fifty years of Brewers pitching stats
Average pitchers used in a game by the Brewers: 1972-2.38; 1982-2.31; 1992-3.09; 2002-3.75; 2012-4.16; 2022-4.42. The increase in pitchers used from 1972 to 2022 for the Brewers is just under 86%.
Complete games by Brewers pitchers: 1972-37; 1982-34; 1992-19; 2002-7; 2012-0; 2022-0. As you see, the Brewers pitching staff had 37 complete games in 1972… from 2006-22, 17 seasons, the Brewers had a combined total of 39 complete games.
Saves by the Brewers pitchers: 1972-32; 1982-47; 1992-39; 2002-32; 2012-44; 2022-52. Saves increased for the Brewers about 63% from 1972 to 2022.
The bottom line: There’s a good chance the average number of pitchers used per team, per game will continue to increase, albeit a little bit every year; the total number of complete games will probably remain few and far between; and saves will likely stay about the same (there have been 1,200 total saves in baseball in 17 of the last 25 seasons). It will likely be the case also with the Brewers.
For More Great Wisconsin Sports Content
Follow me on Twitter at @Statsontapp and follow us @WiSportsHeroics for more great content.


