As fans have become increasingly interested in the NFL Draft over the past few years, one of the online tools that has gained popularity is RAS (Relative Athletic Score). Developed by Kent Lee Platte, RAS is a way to measure how athletic a prospect is compared to others of the same position. It is a fun, intuitive way to compare prospects and gain an overview of their athletic profile. For Packers fans, RAS has become particularly valuable – Green Bay frequently covets highly athletic prospects, so RAS has become one indicator of who they may prefer to draft.
There is a problem, however.
RAS, for all its value, groups all members of a position together in its athletic comparisons. This means that a large running back like Derrick Henry (6’2″, 247 lbs.) is measured on the same athletic scale as, say, Darren Sproles. (5’6″ 187 lbs.) This often isn’t a huge deal – for most positions, an athlete is an athlete. Even larger bodies can put up good numbers in athletic testing drills like the 40-yard dash and the 3-cone.
However, this is not the case for the nose tackle. Nose tackles are often the biggest players on the field and can weigh upwards of 320 pounds. Their larger mass makes it much more difficult to move in space – in fact, one of their primary roles revolves around remaining as IMMOVABLE as possible. With these facts in mind, it’s not surprising that many nose tackle prospects test poorly at the combine. While RAS is an extremely valuable tool, it seems like the narrative around nose tackles could benefit from the introduction of a weight-adjustment system that would add needed context to nose tackle RAS. That’s what this article will try to provide.
Methodology
To fairly measure the athleticism of nose tackles, I wanted to find a way to take into account their weights and the effort that it takes to move that weight around. To do this, I settled on force as the keystone for my weight-adjustment system. Force is the energy exerted to achieve the motion of a body. Finding the force that a particular nose tackle has to generate to achieve his athletic testing numbers will allow me to compare his athletic testing to that of an average (lighter) defensive tackle.
I will be using 40-yd dash numbers to calculate force. In the 40-yd dash, a prospect is essentially attempting to generate maximum (or close to maximum) velocity for a short period of time. Finding the force that each prospect generates in their 40-yd attempts will allow me to compare the effort required for prospects to achieve maximum velocity. In other words, by finding force generated, I will be able to quantify how hard a player has to work within the context of their weight to achieve maximum velocity.
Force (F) is determined by finding mass multiplied by acceleration (F=ma). For simplicity’s sake, we’ll be using the the weight of the individual player in pounds as the mass (m). Acceleration (a) is the change in velocity that an object experiences divided by time elapsed during the object’s motion (a=∆v / ∆t), so force can be expressed F=m x ∆v / ∆t. ∆v means “change in velocity,” and ∆t means “change in time.” I also wanted to relate momentum (p) – the force of an object in motion – to my calculations. Momentum (p) can be determined by finding mass multiplied by velocity (p=mv). To relate force and momentum, we can express the original force equation (F=m*∆v / ∆t) as F=∆p / ∆t.
To find the change in momentum (∆p), we subtract the initial momentum from the final momentum. To find the change in time, we subtract the initial time from the final time. Thus, F=∆p / ∆t is the same as F=p(final) – p(initial) / time(final) – time(initial). Again, p=mass x velocity, so F = mv(final)-mv(initial) / ∆t. If you still need clarification, here’s a good video.
So, we need three values. Mass, velocity (v), and time elapsed. Mass is the weight of the player. Velocity (the speed of a body in a certain direction) can be calculated by finding the distance (d) traveled divided by the time (t) traveled (V=d / t). We can find that by using a player’s 40-yard dash info. For our initial calculations, we only need the final velocity value, since initial velocity in the 40-yd dash is zero. Thus, final velocity would be 40 yards divided by the time a player recorded in the dash. Finally, change over time (∆t) is the difference between when the player started the 40-yard dash and when they finished it.
All final results are rounded to the nearest hundredth.
Calculations
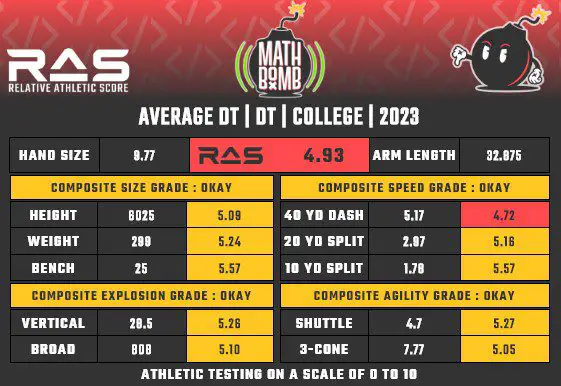
First, we want to find the average force generated by a defensive tackle during their 40-yard dash. Luckily, the RAS site records an “Average Defensive Tackle” card, averaging out the testing results for for all database members in the DT position group.

To find the force generated we need mass, velocity (40 yds / dash time), and change over time. The mass of the average DT is 299 lbs. The velocity is 40 yds / 5.17 sec. Change over time is easy to find – the initial time is zero and the final time is their 40 time. 5.17 sec. – 0 sec. = 5.17 seconds. So, m = 299 lbs., v = 40 yds / 5.17 sec., and ∆t = 5.17 seconds. We can now solve F = mv(final)-mv(initial) / ∆t. Remember, mv(initial) is zero because initial velocity is zero, so the problem can be written out F = 299 lbs. x (40/5.17) / 5.17 seconds. F = 447.46 newtons (the force generated by the average DT during their 40-yd dash is 447.46 newtons).
Case Study
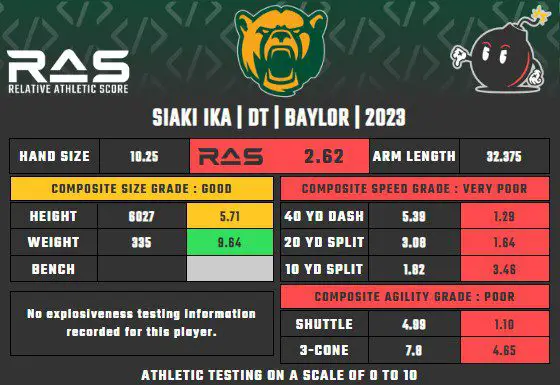
To compare the average force generated by a DT to the force generated by a heavier nose tackle, I chose to calculate the force that Siaki Ika generated during his testing. Before weight-adjustment, he recorded a poor RAS of 2.62. Will weight-adjustment make a significant difference?

Ika’s mass is 335 lbs. The velocity he generated in the 40-yd dash is 40 yds. / 5.39 sec. His change over time is 5.39 – 0. Again, initial velocity is zero, so to find force generated, we need to find F = 335 lbs. x (40/5.39) / 5.39 seconds. Working this out, we can determine that F = 461.24 newtons.
This indicates that Ika generated 461.24 newtons of force in his 40-yd dash, while an average DT generated 447.46 newtons. However, is this method the most accurate way to determine the force of a 40-yard dash attempt? The force generated is not equal across the entire attempt. Players are sometimes faster in their first 10 yards – a value measured in the 10-yard split. It may be more accurate to find the force generated in the 10-yard split, find the force generated in the remaining 30 yards, and average the two amounts.
For an average DT, the 10-yard split is 1.78 seconds. We can use the original formula to determine force as before: F = mv(final)-mv(initial) / ∆t. Like before, the initial momentum and the initial time are zero, so the equation reduces to F = 299 lbs. x (10/1.78) / 1.78 seconds. The force generated in an average DT’s 10-yd split is 943.69 newtons. Going through the same process for Ika, we get the formula F = 335 lbs. x (10/1.82) / 1.82. Ika’s force generated is 1011.35 newtons.
For the remaining 30 yards, the initial time and velocity will no longer be zero since we’re beginning in a 40-yd dash attempt already in progress. We need to solve for F = mv(final)-mv(initial) / ∆t, or, expressed differently, F = mv(final)-mv(initial) / time(final)-time(initial).
Inputting our values for the average DT, we get F = 299(40/5.17) – 299(10/1.78) / 5.17 – 1.78. Solving for the final answer, we get F = 186.89. To find the average force, we add the 10-yd force and the 30-yd force and divide by two. For the average DT, this would be F = 943.69 + 186.89 / 2. This results in an average force of 565.29 newtons.
Going through the same process for Ika, we solve for F = 335(40/5.39) – 335(10/1.82) / 5.39 – 1.82. Using this equation, we get a 30-yd force amount of F = 180.79 newtons. Combining that with his 10-yd force (1011.35 newtons) and averaging the values, we get an average force of 596.07 newtons.
Comparison
Now that we have the average force generated by an average DT on their 40-yd dash and the average force of a case study subject (Siaki Ika), we can compare the two numbers to find out how much more or less work it took Ika to reach maximum velocity. This process is fairly simple. If we accept the force value for an average defensive tackle (565.29 newtons) to be a baseline, we need to find what part of the baseline our case study (596.07 newtons) is. We can determine this by finding 596.07/565.29. Solving for this amount, we find that our case study is 596.07/565.29 = 1.05. In essence, this means that to achieve maximum velocity, Siaki Ika needs to exert 105% of the effort that an average DT does.
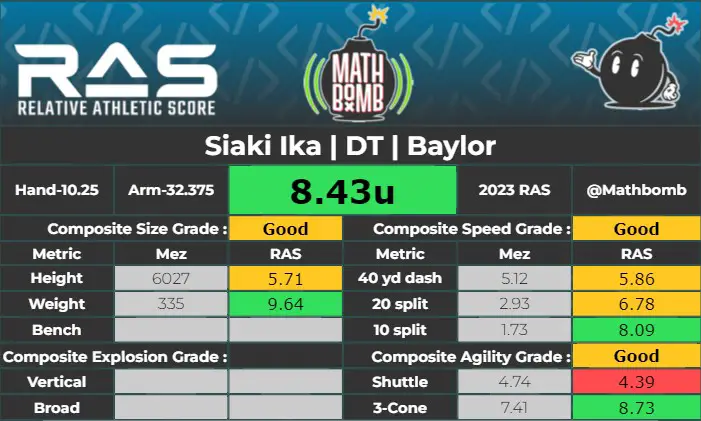
To find Ika’s weight-adjusted RAS, we need to account for this extra force required. We can do this by shaving 5% off of his testing numbers and using the new values to determine his RAS. Doing so is meant to approximate what his testing numbers would look like if the force generation necessitated by his weight was the same as that of an average DT – ie. he did not weigh above the average, and so did not need to generate extra force to achieve maximum velocity. Here’s Ika’s weight-adjusted RAS. The weight and height are unchanged, but the 5% reduction is applied to his 40-yd dash numbers and agility drill numbers.

Adjusted for weight, Ika’s RAS reflects a much better athletic profile than vanilla RAS does. His 3-cone numbers and 10-yd split in particular stand out. To clarify, this updated card is supposed to show what his actual testing numbers are equivalent to when adjusted based on his weight. Thus, Ika recording a 1.82 second 10-yd split is equivalent to an average DT recording a 1.73 10-yd split, and so on. I believe that using this weight-adjusted RAS is a more accurate reflection of how athletic Ika is.
Conclusion
My method of weight-adjusting RAS is far from perfect. In some cases, weight is not a hinderance to better athletic performance. Instead, adding explosive muscle power can increase athletic performance, rather than harm it. In addition, it may be difficult to fact-check this type of force generation using other drill types, since they lack the easily usable, static, straight-line velocity measurement that the 40-yard dash provides. There are also likely some issues with using force as a stand-in for “athleticism.” Athletes on the football field are engaging in much more dynamic activities than running in a straight line. Still, I believe that some sort of weight-adjustment method is necessary to qualify RAS rankings for nose tackles. Big men are athletes too. Hopefully this system can provide a tool – or at least a starting point – in developing a better understanding of nose tackle athleticism.
For More Great Wisconsin Sports Content
Follow me on Twitter at @Sam_DHolman and follow us @WiSportsHeroics for more great content. To read more of our articles and keep up to date on the latest in Wisconsin sports, click here! Also, check out our merch store for some amazing WSH merchandise!


